


Torque-slip and torque-speed characteristics are basic for understanding how an induction motor develops torque and responds to changing operating conditions. These curves show the relationship between torque, slip, and rotor speed from standstill to normal running, overload, and other operating regions. They also help explain stable operation, maximum torque, rotor resistance effects, and the use of these characteristics in motor analysis.
Torque-Slip and Torque-Speed Overview
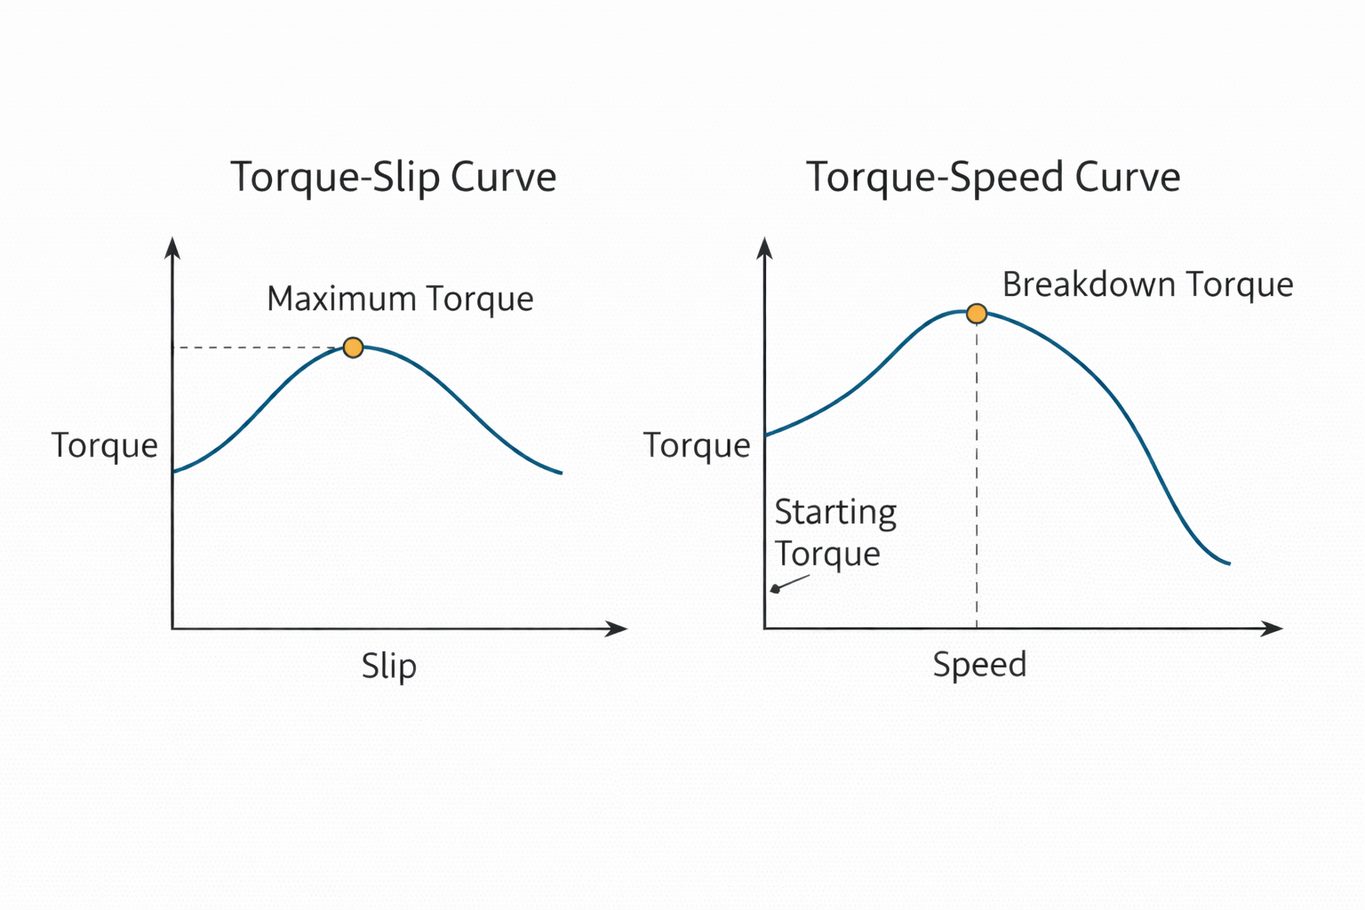
The torque-slip and torque-speed characteristics describe the same electromagnetic behavior of an induction motor from two perspectives.
The torque-slip curve shows how torque varies with slip, while the torque-speed curve presents the same relationship using rotor speed instead of slip. Since rotor speed is directly measurable, the torque-speed characteristic is more commonly used in practical analysis.
These two representations are interchangeable and provide a foundation for understanding motor performance under different operating conditions.
Slip as the Basis of Torque Production
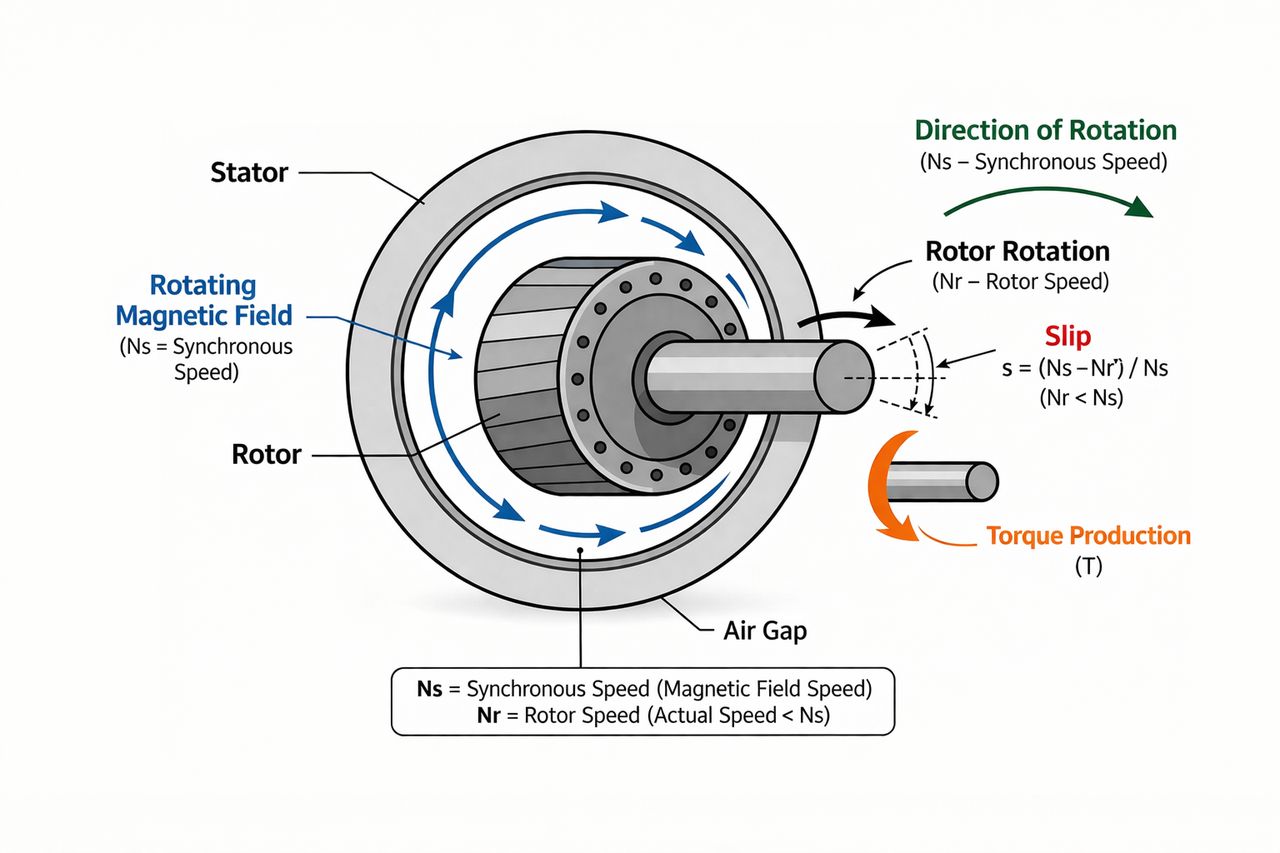
An induction motor needs a slip to produce torque. Slip creates relative motion between the rotating magnetic field and the rotor. This motion induces rotor EMF and rotor current, which interact with the magnetic field to produce torque.
If the rotor reached synchronous speed, there would be no relative motion. In that condition, rotor EMF and rotor current would disappear, so the motor would produce no torque. This is why an induction motor does not normally run at exact synchronous speed.
When the mechanical load increases, the rotor slows slightly. This increases slip and allows the motor to develop more torque. In this way, slip allows the motor to respond automatically to load changes.
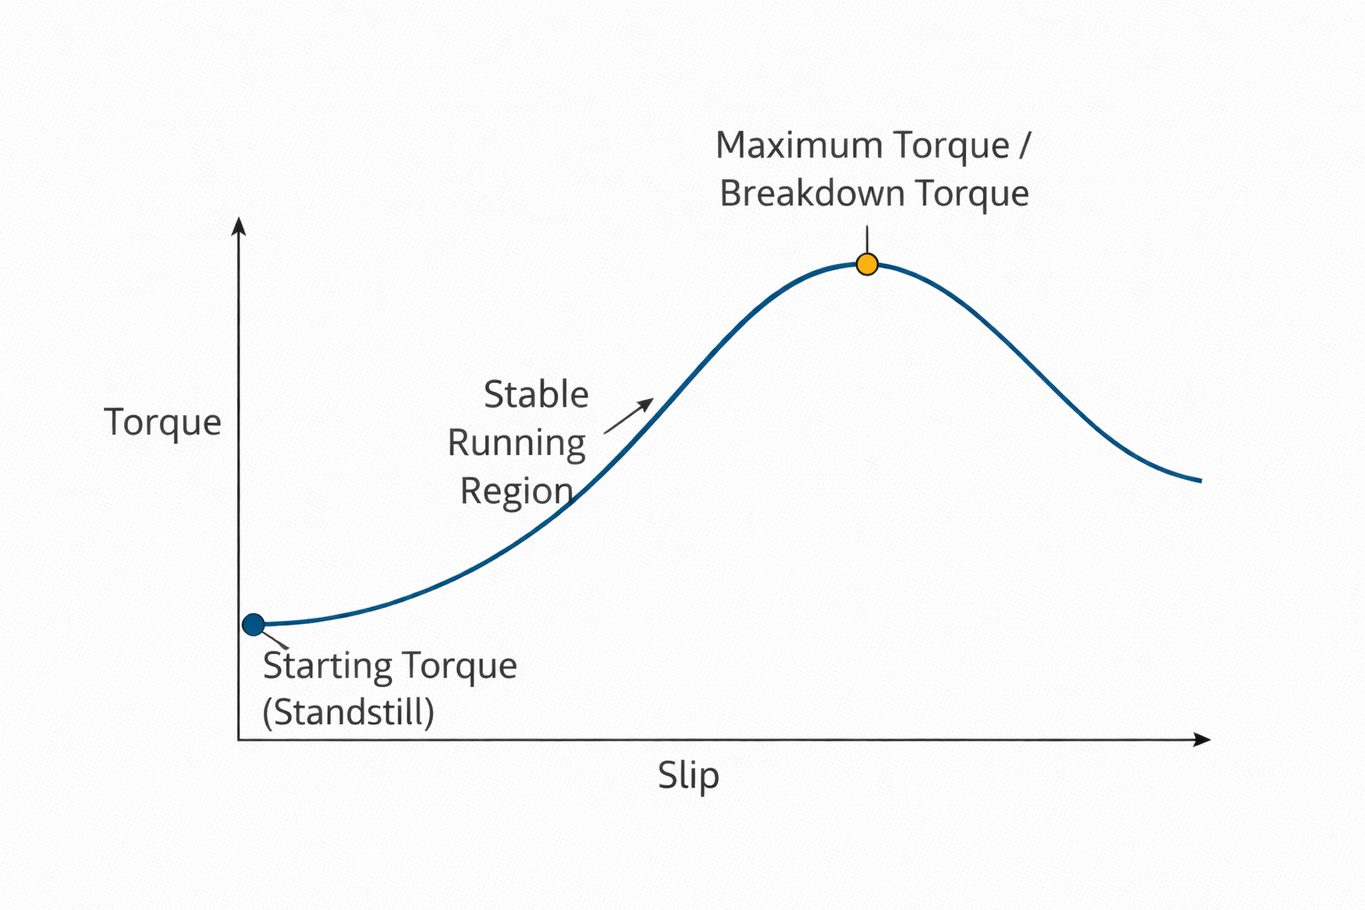
Reading the Torque-Slip Characteristic
Low-Slip Region: Stable Running
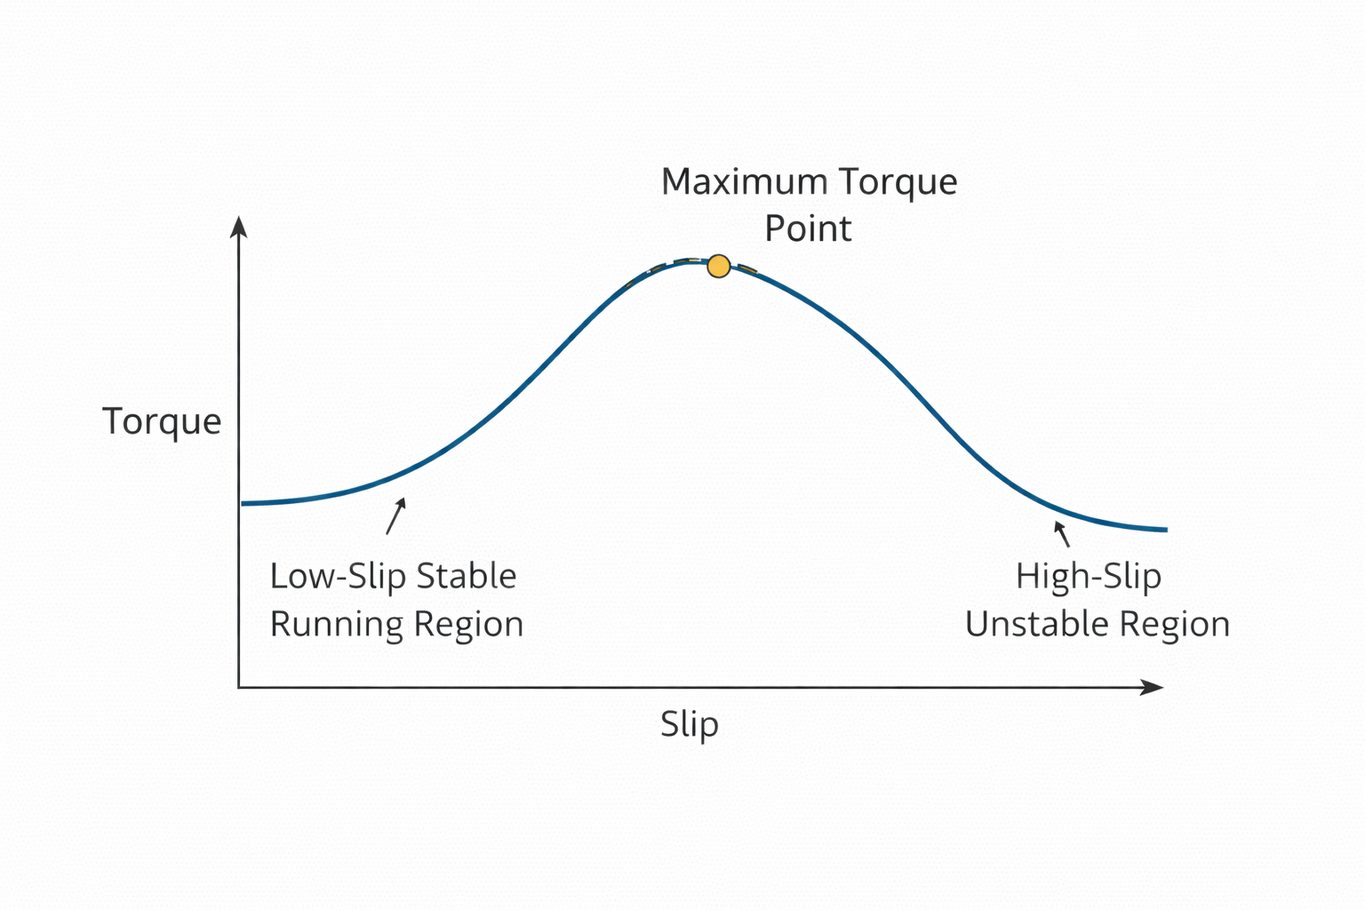
In the low-slip region, the motor runs close to synchronous speed. In this part of the curve, torque increases almost in direct proportion to slip. When the load increases slightly, slip also increases slightly, and the motor develops more torque.
This is the normal operating region of the induction motor. It is the stable part of the curve, where speed stays fairly constant, and torque adjusts smoothly as load changes.
Middle Region: Maximum Torque
As slip continues to increase, torque rises until it reaches its highest value. This peak is called maximum torque, pull-out torque, or breakdown torque.
This point shows the greatest torque the motor can produce before its speed drops more sharply. It marks the upper limit of stable torque development. Near this point, the motor can handle a heavier load for a short time, but it should not remain in this condition for long.
The condition for maximum torque is commonly written as:
R₂ = sX₂₀
High-Slip Region: Falling Torque and Stall Risk
After the maximum torque point, further increase in slip causes the torque to decrease. This part of the curve is unstable.
In this region, the motor slows down while losing torque. If the load stays too high, the motor may stall. Current and heating also rise quickly, so operation in this range is not suitable for normal running.
Torque Variation with Motor Speed
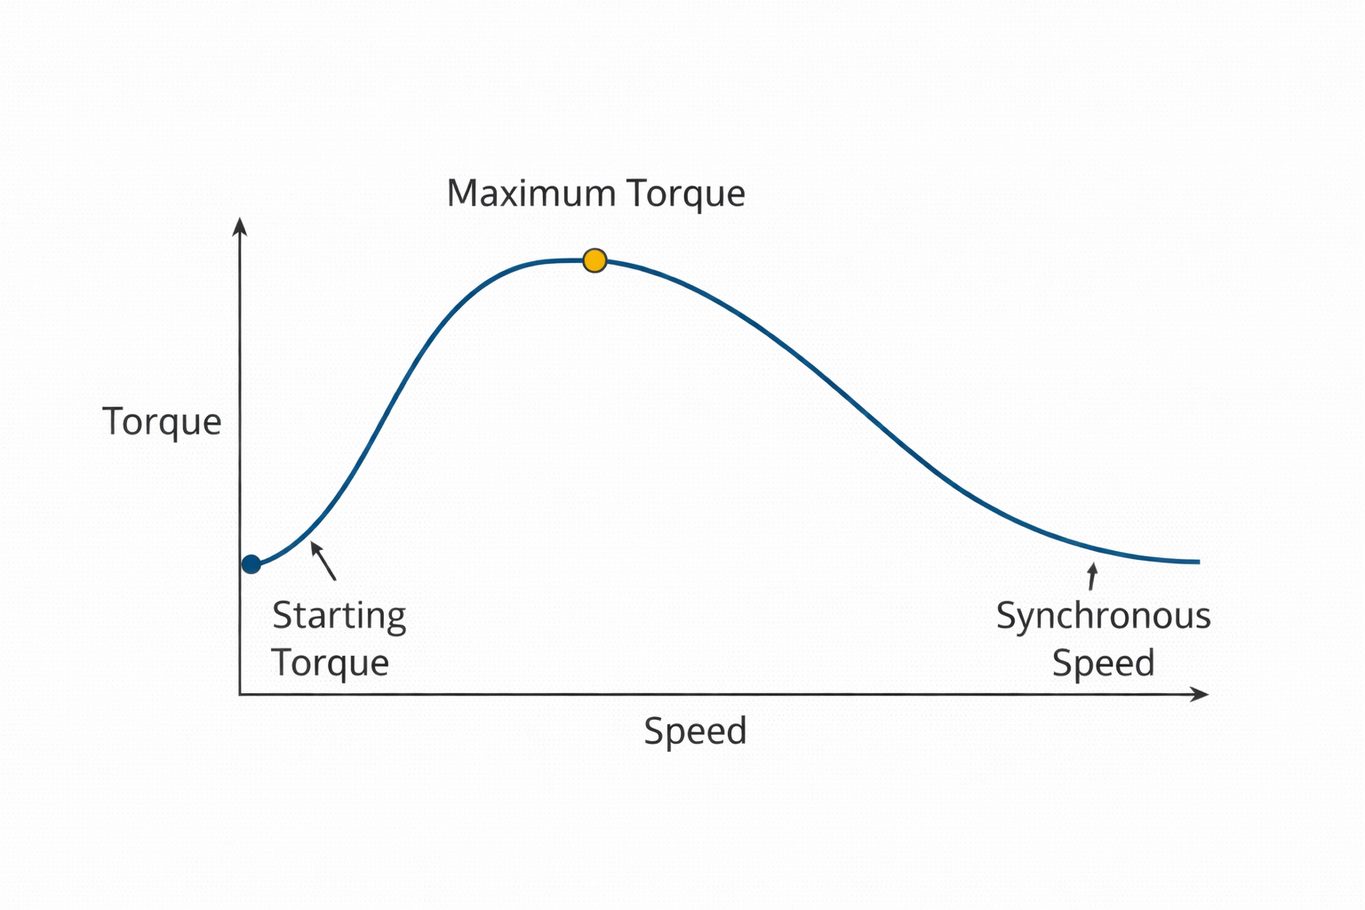
The torque-speed characteristic shows how motor torque changes as rotor speed increases from zero to near synchronous speed. At standstill, the rotor speed is zero and slip is 1, so the motor develops starting torque. As the rotor accelerates, torque rises until it reaches the maximum torque at an intermediate speed. Beyond this point, torque decreases as the rotor speed approaches synchronous speed.
This curve provides a direct view of motor behavior during starting, acceleration, and normal running. Since rotor speed and slip are related, the speed at maximum torque can be written as:
Nₘ = Nₛ (1 − sₘ)
where 𝑁𝑚 is the rotor speed at maximum torque, 𝑁𝑠 is the synchronous speed, and 𝑠𝑚 is the slip at maximum torque.
Torque Points and Stable Operation
Starting torque is the torque produced when the motor is at a standstill. It shows how much turning force is available when the motor begins to rotate.
Maximum torque is the highest torque the motor can develop before torque begins to decrease. It marks the upper limit of torque the motor can support while still continuing to run properly.
Stable running takes place on the rising part of the torque-slip curve, before the maximum torque point. In this region, an increase in load causes the motor to produce more torque, which helps the motor maintain normal operation.
For normal operation, the motor should run well below breakdown torque so that it remains in a stable operating range.
Rotor Resistance and Curve Shift
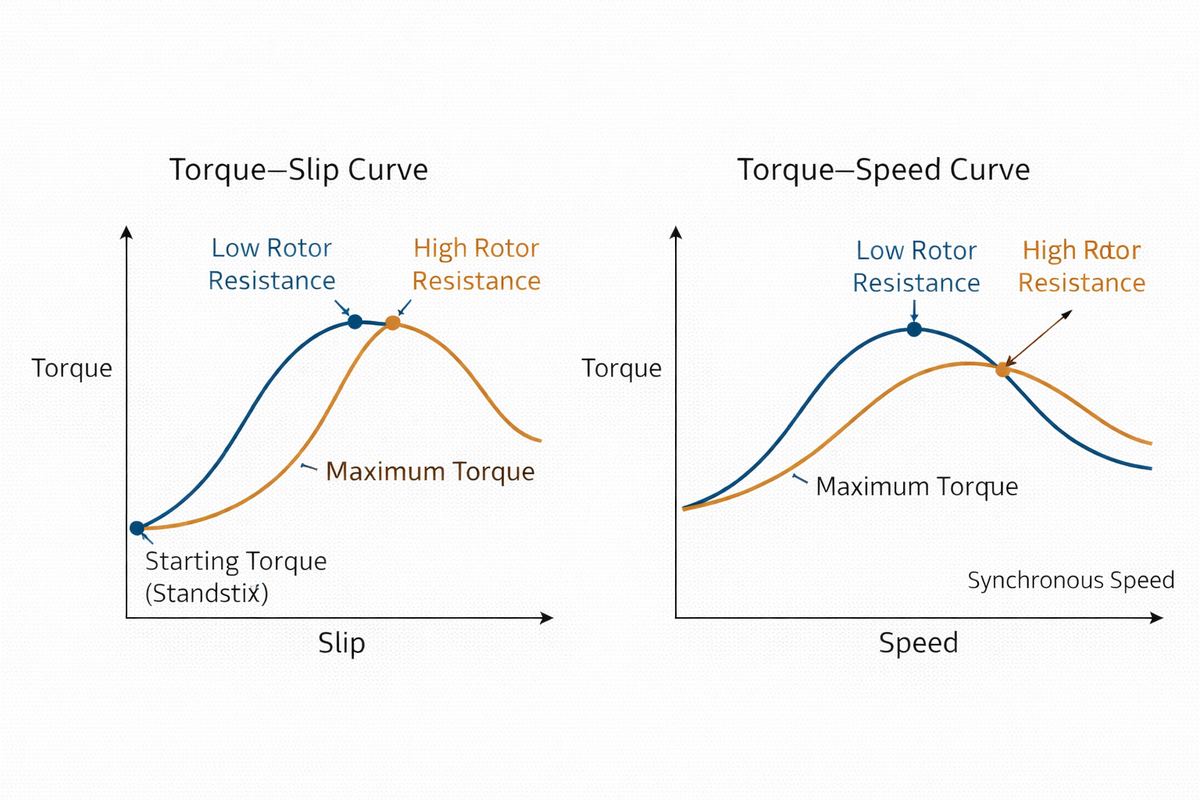
Rotor resistance changes the position of the peak on both the torque-slip and torque-speed curves. When rotor resistance increases, the slip at maximum torque becomes higher. Because of this, the speed at maximum torque becomes lower. The peak shifts toward higher slip and lower speed.
A basic point is that the value of maximum torque stays nearly the same. What changes is the location of that peak, not its height.
This means the motor can develop strong torque at higher slip, which improves starting behavior. At the same time, peak torque is reached at a lower speed.
Operating Regions of the Torque Curves
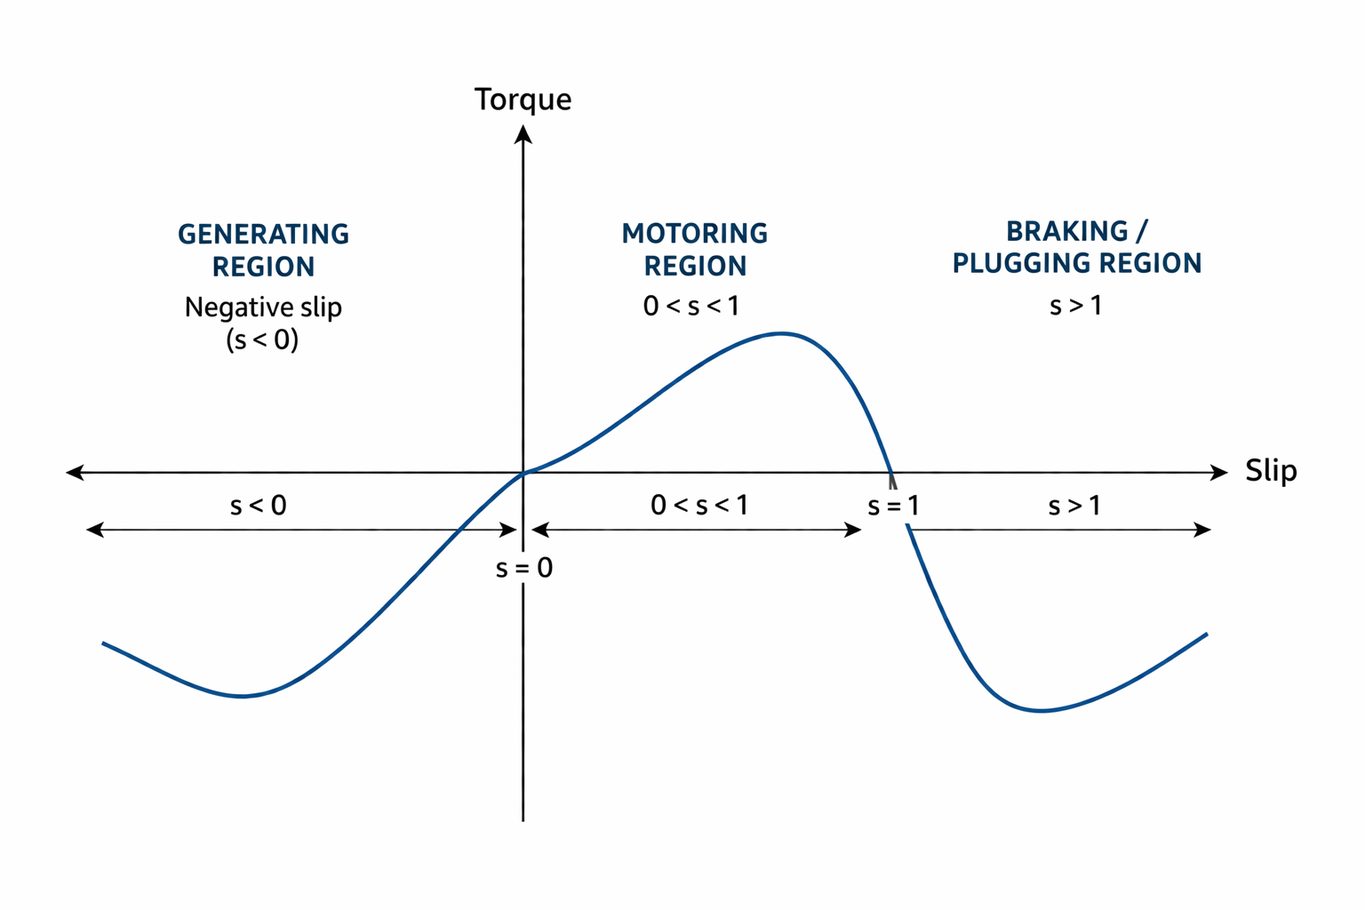
Motoring Region
In motoring operation, the rotor runs below synchronous speed and produces useful mechanical output. This is the standard running condition of the induction motor.
Generating Region
When the rotor is driven above synchronous speed, the machine operates as a generator. In this condition, mechanical input is converted into electrical output.
Braking Region
When the machine enters the braking region, the developed torque opposes rotation and slows the motor. One method is plugging, which creates reverse torque for fast stopping. This also causes increased heating because energy is released as heat.
Use of Torque-Slip and Torque-Speed Characteristics
• Checks starting ability
• Shows acceleration behavior
• Helps evaluate speed stability
• Identifies overload limits
• Helps detect stall risk
• Shows performance during braking and generating conditions
Steps for Reading Torque-Slip and Torque-Speed Curves
• Identify the synchronous speed
• Find the starting torque at standstill
• Locate the normal running region near synchronous speed
• Find the maximum torque point on the curve
• Check whether the required load stays in the stable region
• Review whether overload could move the motor into the falling-torque region
• Consider the effect of rotor resistance on starting and acceleration
Conclusion
Torque-slip and torque-speed characteristics provide a clear way to study induction motor performance. They show how torque is produced, how it changes with slip and speed, where stable running occurs, and what happens near overload or stall. They also explain how rotor resistance shifts the curve and how the motor behaves in motoring, generating, and braking regions. These characteristics are useful for understanding, evaluating, and reading motor behavior correctly.
Frequently Asked Questions [FAQ]
What shapes the torque-slip curve?
Rotor resistance, rotor reactance, and supply voltage shape the curve.
How does lower voltage affect torque?
Lower voltage reduces torque across the curve.
Does rotor resistance change the maximum torque value?
No. It changes the position of maximum torque.
What happens when the slip increases too much?
Efficiency drops, heating rises, and stall risk increases.
How does frequency affect the torque-speed curve?
Frequency changes synchronous speed, so the curve shifts.
Why is the stable region required?
It allows the motor to adjust torque as load changes and keep running properly.


